The Platte River Stream Flow "Flat Lines" for the 4th Year in a Row
Image
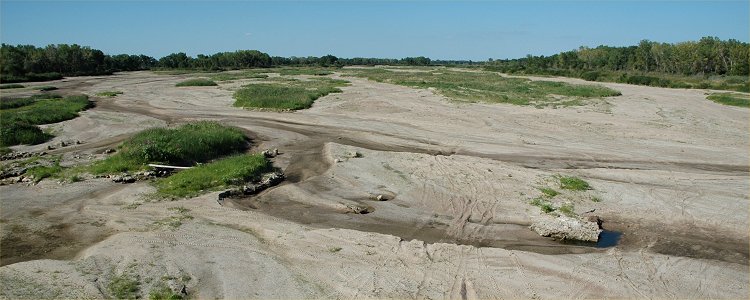
© Ken Dewey, SNR, UNL. August 5, 2005: Looking Northeast from
the Nebraska Highway 34 bridge,
near
Grand Island, Nebraska. Despite slightly above normal rainfall this
year upstream of this location, the
Platte
river has run out of water for the 4th year in a row.
Image
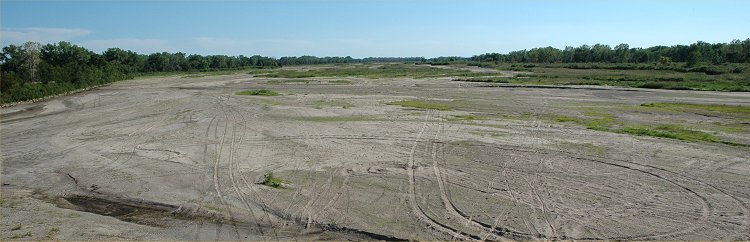
© Ken Dewey, SNR, UNL. August 5, 2005: Looking Southwest from
the Nebraska Highway 34 bridge,
near
Grand Island, Nebraska. This is also the river gauge location (which
is noted by the red circle on the following map).
PHOTO GALLERY THIS YEAR (2005)
Central Platte River Year 2005 Drought Photos
PHOTO
GALLERYS LAST THREE YEARS
Central
Platte River Year 2004 Drought Photos
Central
Platte River Year 2003 Drought Photos
Central
Platte River Year 2002 Drought Photos
Related:
Lower
Platte Tour 2005
Nebraska
statewide precipitation and drought information, 1999 to 2005
Lake
McConaughy only rises 3 feet during the past 12 months
USGS Station 06770500 Grand Island, Nebraska.
Platte River Flow July 27 - August 5, 2005
Note the flow (blue line) fell to ZERO on August 3, 2005.
Platte
River Flow January 1, 2005 - August 5, 2005
Note
the peak flow (blue line) of
6,000 cubic feet per second on May 12, 2005.
This
peak was the result of a 10-14 inch rainfall in the Hastings to Wood River,
Nebraska
area the evening of May 11, 2005. There was flooding
in Grand Island.
Platte River Flow August 6, 2003 - August 5, 2005
Note the flow (blue line) fell to ZERO in the Summer of 2003, 2004, and 2005.
Following the irrigation season, flow began again in November 2003,
late October 2004, and would be expected to region again during the fall of 2005.