The Southwestern U.S Drought of 2003,
Some Hydrological Impacts

Nevada is the fastest growing state in the nation.
Las Vegas is the fastest growing city in the nation.
Las Vegas has the highest per-capita consumption of water in the world.
This site examines the current drought and its impact on water resources in this region of the U.S.
Photo© Ken  Dewey, SNR, UNL.
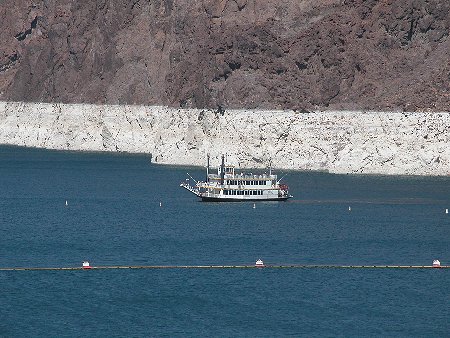
A two story sightseeing boat on Lake Mead is dwarfed by the white ring around the lake.  The white ring is rock area exposed due to the dropped level of the lake.  Click HERE 
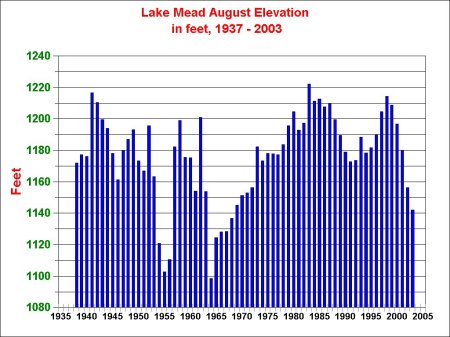
or on the graph to see a larger version.
About 88 percent Southern Nevada's water is derived from the Colorado River. The other 12 percent of  their water comes from groundwater that is pumped out through wells.
Lake Mead Elevation Data

Photo Galleries

Photo Gallery 1: Lake Mead and Dam Photo Gallery 2: Las Vegas Scenes
Photo Gallery 3: Water Usage around the city Photo Gallery 4: Flash Flooding
Photo Gallery 5: Dust Devils Photo Gallery 6: Lake Mead Full and Today
Photo Gallery 7: Aerial Photo, 1950 and 1999 Photo Gallery 8: Las Vegas Bay Marina
External to this site: Huge Changes in Marina

Where does the water from Lake Mead go for household use?
Irrigation: 47%
Water Waste: 23%
Toilet: 8%
Laundry: 6%
Other Indoor Use: 6%
Faucet: 5%
Shower: 5%
Source, City of Henderson, Las Vegas and North Las Vegas, 2002.

Information on the Current Drought in the Las Vegas Area

Southern Nevada Drought Plan Stages Southern Nevada Water Restrictions
Southern Nevada Water Restrictions Southern Nevada Water Saving Examples
Nevada Population, 1861-2000 Las Vegas & Clark County Population 1910-2002
   
External to this report: External to this report:
Las Vegas Flash Flood, August 19, 2003 Drought Monitor Maps
Las Vegas Flash Flood, August 19, 2003 Photos History of Las Vegas
Flash Flood Fails to Make Dent in Drought Feds Warn of tapping out water supply
August 2003 Flooding Stories New Lake Mead Water Intake
Las Vegas Flash Flood History

Climate Summary Maps for the Southwestern U.S.

Climate Summary Maps (May-July 2003) Climate Summary Maps (3-year departures)


November 26, 2003 - Current Lake Levels
Southwestern U.S. - Data Source: Arizona Game and Fish
LAKE
MAXIMUM
ELEVATION
MAXIMUM
SURFACE
ACRES
CURRENT
ELEVATION
FEET BELOW
MAXIMUM
CURRENT
SURFACE
ACRES
PERCENT FULL
Alamo
1235
13,300
1089
146
 2079
5
Apache
1914
2,656
1905
9
 2,518
91
Bartlett
1798
2,815
1771
276
 2,043
63
Canyon
1660
947
1657
3
930
94
Havasu
450
20,400
447
3
 19,100
91
Horseshoe
2026
2,812
1959
67
 826
6
Mead
1229
162,700
1140
89
 105,900
56
Mohave
647
28,800
637
10
 26,200
85
Pleasant
1702
9,957
1640
62
6,061
43
Powell
3700
160,800
3601
99
95,900
49
Roosevelt
2151
21,493
2076
75
10,219
29
Saguaro
1529
1,264
1525
4
 1,211
93
 San Carlos
2525
 19,985
 2415
 110
 2,593
3
Elevation is feet above sea level, not depth of the lake.
Maximum elevation is the elevation that the water goes into the spillway (not over the top of the dam)
Some lakes, like Havasu, are maintained at a near constant elevation in order to supply water to an aqueduct.

Aerial View of Lake Mead and Hoover Dam, August 11, 2003
Click the Photo to see a much larger version

Photo© Ken Dewey, School of Natural Resources, UNL.


IMPORTANT LINKS:

Western Regional Climate Center

National Drought Mitigation Center

Hoover Dam
 

  Return to:  The Photo Gallery Index Page