Year 2014 Lake Mead Update (July 2014):
Headline: Lake Mead Levels Drop to Historic Lows.
The Bureau of Reclamation noted that Lake Mead, the reservoir created by Hoover Dam, reached its lowest water level since the lake’s initial filling in the 1930s ( News Report).
Lake Mead elevation as of July 11, 2014 was 1081.77 feet, which is 147.23 feet below capacity.
Table of historical Lake Mead Levels.
Current Daily Lake Mead Elevations.
Lake Mead Information:
Lake Mead is the largest reservoir in the U.S. It is located on the Colorado River about 25 miles from downtown Las Vegas and located at the Nevada/Arizona border. It is formed by the Hoover Dam, and when full, Lake Mead is 112 miles long, has a maximum depth of around 500 feet and it also has 550 miles of shoreline. Lake Mead has not reached capacity for more than a decade and has been lowered due to two factors: (1) increased human demand for water in the Las Vegas Valley and (2) by a prolonged drought in the Southwestern U.S.
Lake Mead Elevations:
Lake Mead Maximum Elevation (Capacity): 1229.0 feet
Lake Mead Elevation, July 2014: 1081.77 feet (147.23 feet below capacity)
Lake Mead elevation, most recent peak, October 1998: 1215.76 feet (13.24 feet below capacity)
Lake Mead elevation, record minimum, July 11, 2014, 1081.77 feet (146.64 feet below capacity)
Lake Mead Facts: (Information source, Bureau of Reclamation, Lower Colorado Region, Boulder City, NV)
What is the lake's elevation at high-water?
The high-water line is at 1,229 feet above sea level. At this elevation, the water would be more than 7 1/2 feet over the top of the raised spillway gates, which are at elevation 1,221.4 feet. All lands below elevation 1,250 have been retained for reservoir operations purposes.
What is the reservoir's area?
At elevation 1,221.4 feet the reservoir covers about 158,500 acres or 248 square miles.
How long and wide is the reservoir?
At elevation 1,221.4 feet, Lake Mead extends approximately 110 miles upstream toward the Grand Canyon. It also extends about 35 miles up the Virgin River. The width varies from several hundred feet in the canyons to a maximum of eight miles.
How much water will Lake Mead hold?
Approximately 28,945,000 acre-feet. An acre-foot is the amount of water required to cover one acre to a depth of one foot, or approximately 326,000 gallons. The reservoir will store the entire average flow of the Colorado River for two years. That is enough water to cover the State of Pennsylvania to a depth of one foot.
How is the reservoir capacity allotted?
Below elevation 1,229, about 1,500,000 acre-feet of storage capacity is reserved exclusively for flood control; about 2,547,000 acre-feet for sedimentation control; about 18,438,000 acre-feet for joint use (flood control, municipal and industrial water supply, irrigation and power); and 7,683,000 acre-feet for inactive storage.
Who operates the dam and reservoir?
The Bureau of Reclamation operates and maintains the dam, power plant and reservoir. The National Park Service administers recreational activities in and around Lake Mead as part of Lake Mead National Recreation Area.
What is the estimated annual evaporation of the reservoir?
About 800,000 acre-feet each year.
Where does the water from Lake Mead go for household use?
|
Irrigation: 47%
|
Water Waste: 23%
|
Toilet: 8%
|
Laundry: 6%
|
|
Other Indoor Use: 6%
|
Faucet: 5%
|
Shower: 5%
|
|
Source, City of Henderson, Las Vegas and North Las Vegas.
Graphing the Changes in Elevation of Lake Mead:
The following graph shows the elevation of Lake Mead for each July 1935 through 2014.
The month of July was chosen to correspond to my most recent visit to Lake Mead in July 2014.

> The level of Lake Mead at Hoover Dam started falling in November 1998, just after it reached the
all-time high of 1215.76 feet.
> Lake Mead reached its lowest point at 1081.77 feet on July 11, 2014, 133.99 feet below the peak of 1998.
> Lake Mead was dedicated in 1935 and began filling up that year. Note that the elevation in July 1935 and 1936 (see table: Table of historical Lake Mead Levels.) was only 928.40 feet and 1020.40 feet. Because Lake Mead was in the process of filling up in 1935-36, the actual record minimum elevation following the initial fill up of the Lake occurred on July 11, 2014. The level of the lake could continue to fall below the July 11, 2014 elevations.
> It took 19 years after the 1964 low point for Lake Mead to fill up again.

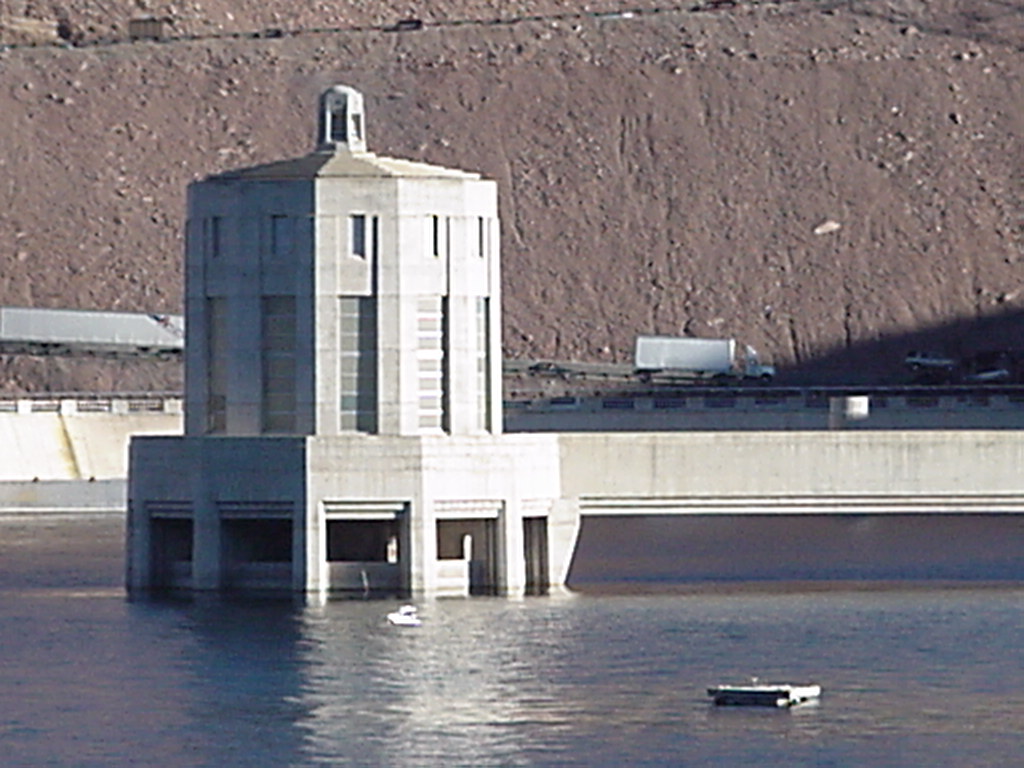
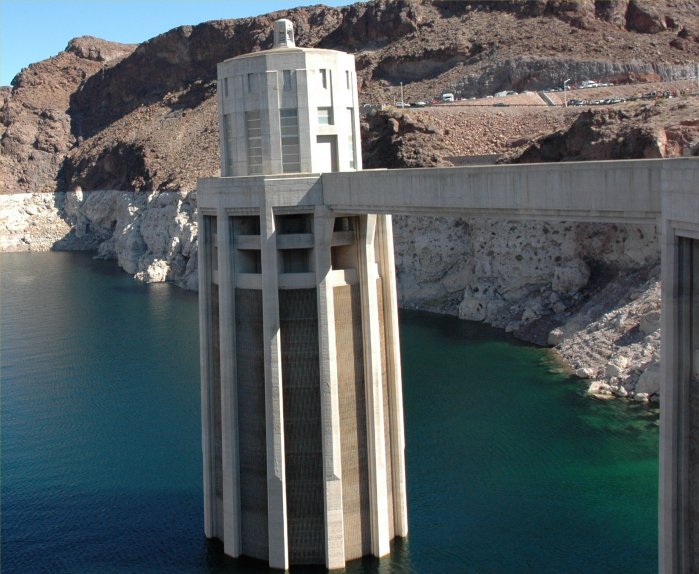
Lake Mead, July 2014. Note the bathtub ring with the water level down 147 feet from capacity.

July 2014 Lake Mead. Note the boats for scale compared to the top of the bathtub ring.
Photos from 2012:
Photos of Lake Mead Full and Lake Mead in December 2012 Elevation

|

|
Lake Mead when full.
Photo courtesy of the Bureau of Reclamation
|
Lake Mead when full.
Photo courtesy of the Bureau of Reclamation
|
 |
 |
| Looking back toward Lake Mead from near the spillway on the east side of the dam. Image © K. Dewey, SNR, UNL |
Lake Mead in December 2012 is down 95.4 feet from the 1998 peak elevation. The white rock is the "bathtub" ring for Lake Mead. The exposed rock is white due to salt deposits while submerged.
Image © K. Dewey, SNR, UNL
|
|
|
|
April 1998: Elevation 1212.74 feet
|
December 2012: Elevation 1120.36 feet
Photo: Ken Dewey, SNR
|
The Phenomenal Growth of Las Vegas:
The recent rapid increase in both residents and tourists coming to Las Vegas placed a huge demand on water resources.
However this pace has dramatically slowed the past few years due to the large scale U.S. economic slowdown.
1905 -- Town of Las Vegas established by auctioning of land.
1911 -- The city of Las Vegas is incorporated.
1931 -- Hoover Dam construction begins in Black Canyon.
Clark County and Las Vegas Population 1910-2013
Clark County............................................................................ Las Vegas
| |
|
Decade |
Decade |
Annual |
Annual |
|
|
Decade |
Decade |
Annual |
Annual |
|
| |
Clark Co |
Population |
% |
Population |
% |
|
Las Vegas |
Population |
% |
Population |
% |
|
Year |
Population |
Increase |
Increase |
Increase |
Increase |
|
Population |
Increase |
Increase |
Increase |
Increase |
Year |
1910 |
N/A |
|
|
|
|
|
945 |
|
|
|
|
1910 |
1920 |
4,859 |
|
|
|
|
|
2,304 |
1,359 |
143.81% |
|
|
1920 |
1930 |
8,422 |
3,563 |
73.33% |
|
|
|
5,165 |
2,861 |
124.18% |
|
|
1930 |
1940 |
16,414 |
7,992 |
94.89% |
|
|
|
8,422 |
3,257 |
63.06% |
|
|
1940 |
1950 |
48,289 |
31,875 |
194.19% |
|
|
|
24,624 |
16,202 |
192.38% |
|
|
1950 |
1960 |
127,016 |
78,727 |
163.03% |
|
|
|
64,405 |
39,781 |
161.55% |
|
|
1960 |
1970 |
273,288 |
146,272 |
115.16% |
|
|
|
125,787 |
61,382 |
95.31% |
|
|
1970 |
1980 |
463,087 |
189,799 |
69.45% |
|
|
|
164,674 |
38,887 |
30.91% |
|
|
1980 |
1990 |
741,459 |
278,372 |
60.11% |
|
|
|
286,600 |
121,926 |
74.04% |
|
|
1990 |
1991 |
829,839 |
|
|
88,380 |
11.92% |
|
298,321 |
|
|
11,721 |
4.09% |
1991 |
1992 |
870,692 |
|
|
40,853 |
4.92% |
|
310,197 |
|
|
11,876 |
3.98% |
1992 |
1993 |
919,388 |
|
|
48,696 |
5.59% |
|
330,472 |
|
|
20,275 |
6.54% |
1993 |
1994 |
986,152 |
|
|
66,764 |
7.26% |
|
352,305 |
|
|
21,833 |
6.61% |
1994 |
1995 |
1,040,688 |
|
|
54,536 |
5.53% |
|
374,239 |
|
|
21,934 |
6.23% |
1995 |
1996 |
1,119,708 |
|
|
79,020 |
7.59% |
|
405,517 |
|
|
31,278 |
8.36% |
1996 |
1997 |
1,170,113 |
|
|
50,405 |
4.50% |
|
422,884 |
|
|
17,367 |
4.28% |
1997 |
1998 |
1,246,193 |
|
|
76,080 |
6.50% |
|
448,244 |
|
|
25,360 |
6.00% |
1998 |
1999 |
1,321,319 |
|
|
75,126 |
6.03% |
|
466,312 |
|
|
18,068 |
4.03% |
1999 |
2000 |
1,428,690 |
687,231 |
92.69% |
107,371 |
8.13% |
|
484,500 |
198,500 |
69.41% |
18,188 |
3.90% |
2000 |
2001 |
1,498,279 |
|
|
69,589 |
4.87% |
|
498,638 |
|
|
14,138 |
2.92% |
2001 |
2002 |
1,578,332 |
|
|
80,053 |
5.34% |
|
507,219 |
|
|
8,581 |
1.72% |
2002 |
2003 |
1,641,529 |
|
|
63,197 |
4.00% |
|
516,723 |
|
|
9,504 |
1.87% |
2003 |
2004 |
1,747,025 |
|
|
105,496 |
6.43% |
|
534,168 |
|
|
17,445 |
3.38% |
2004 |
2005 |
1,815,700 |
|
|
68,675 |
3.93% |
|
544,806 |
|
|
10,638 |
1.99% |
2005 |
2006 |
1,925,654 |
|
|
109,954 |
6.06% |
|
552,855 |
|
|
8,049 |
1.48% |
2006 |
2007 |
1,996,542 |
|
|
70,888 |
3.68% |
|
559,892 |
|
|
7,037 |
1.27% |
2007 |
2008 |
1,986,146 |
|
|
-10,396 |
-0.52% |
|
562,849 |
|
|
2,957 |
0.53% |
2008 |
2009 |
2,006,347 |
|
|
20,201 |
1.02% |
|
567,641 |
|
|
4,792 |
0.85% |
2009 |
2010 |
2,036,358 |
607,668 |
42.53% |
30,011 |
1.50% |
|
583,756 |
99,256 |
20.49% |
16,115 |
2.84% |
2010 |
2011 |
1,966,630 |
|
|
-69,728 |
-3.42% |
|
589,317 |
|
|
5,561 |
0.95% |
2011 |
2012 |
2,008,654 |
|
|
|
|
|
594,294 |
|
|
|
|
2012 |
2013 |
2,062,253 |
|
|
|
|
|
606,762 |
|
|
|
|
2013 |
| |
, |
|
|
|
|
|
, |
|
|
|
|
|
Year |
|
Decade |
Decade |
Annual |
Annual |
|
|
Decade |
Decade |
Annual |
Annual |
Year |
| |
Clark Co |
Population |
% |
Population |
% |
|
Las Vegas |
Population |
% |
Population |
% |
|
|
Population |
Increase |
Increase |
Increase |
Increase |
|
Population |
Increase |
Increase |
Increase |
Increase |
|
| |
|
|
|
|
|
|
|
|
|
|
|
|
Number of Visitors to Las Vegas (1970-2013):
Number of visitors to Las Vegas in 2013: 39,668,221
Number of visitors to Las Vegas in 2012: 39,727,022
Number of visitors to Las Vegas in 2011: 38,928,708
Number of visitors to Las Vegas in 2010: 37,335,436
Number of visitors to Las Vegas in 2000: 35,849,691
Number of visitors to Las Vegas in 1990: 20,954,420
Number of visitors to Las Vegas in 1980: 11,941,524
Number of visitors to Las Vegas in 1970: 7,361,783
|


