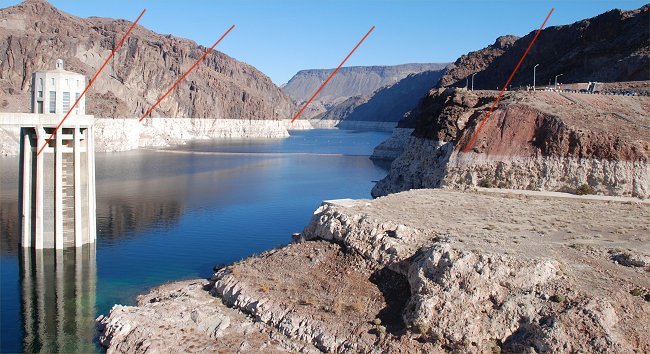
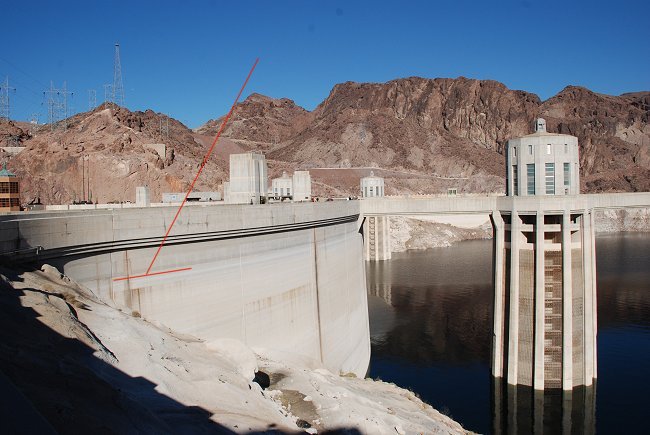
Photo © K. Dewey January 2009: Lake Mead. The red lines mark the exposed "bath tub ring"
around the Lake and indicate the height of the lake at maximum elevation.
NOTE: LINK to more January 2009 Lake Mead/Hoover Dam Photos.
Lake
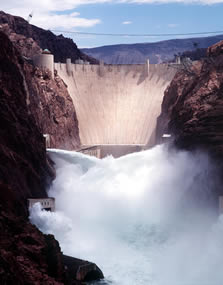
Mead's elevation continues to fall due to (1) continued drought in the
southwestern U.S. and,
(2),
increased population growth with associated demand for water resources.
Lake
Mead's January 2009 elevation, 111.78 feet, is 5 feet lower than last year at this time.
Lake
Mead is 118 feet below maximum elevation! Lake
Mead has fallen to 46% of capacity!
Photo © K. Dewey January 2009: Lake Mead. The
red lines mark the exposed "bath tub ring"
around the Lake and indicate the height of the lake at maximum elevation.
NOTE:
LINK to more January 2009
Lake Mead/Hoover Dam Photos.
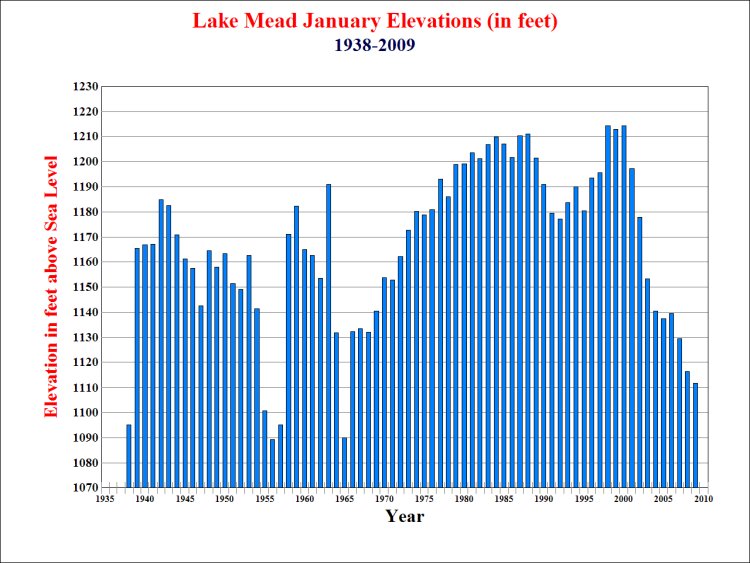 Some Lake Mead Statistics |
| January 2009 Elevation is
1,111.78 feet Maximum Elevation is 1229.70 feet January 2009 Elevation is 118 Feet Below Maximum elevation The level of Lake Mead at Hoover Dam has been falling since October 1998, when it reached the all-time high of 1215.76 feet The January 2009 level of Lake Mead at Hoover Dam has dropped 103.98 feet since October 1998 The January 2009 level of 1111.78 feet is the lowest January level since 1965 when it was only 1089.83 feet. January, 2009 Surface area is 93,900 acres Maximum Surface area is 162,700 acres January 2009 Surface area is 57.7% of Max. Surface area It took 19 years after the 1964 low point for Lake Mead to fill up again. January, 2009 Volume of water is 46% Full LINK TO all of the Lake Mead Elevation Data Archive |
|
(The data in this table are from Arizona Game and Fish)
NOTE: as of January 2009:
Alamo
Reservoir:
Apache
Lake: (Horse Mesa)
Bartlett:
Canyon
Lake: (Mormon Flat)
Lake
Havasu:
Horseshoe
Lake:
Lake
Mead:
Lake
Mohave:
Lake
Pleasant: (Waddell Dam)
Lake
Powell:
Roosevelt
Lake:
San
Carlos:
|
 |
 |
|
|
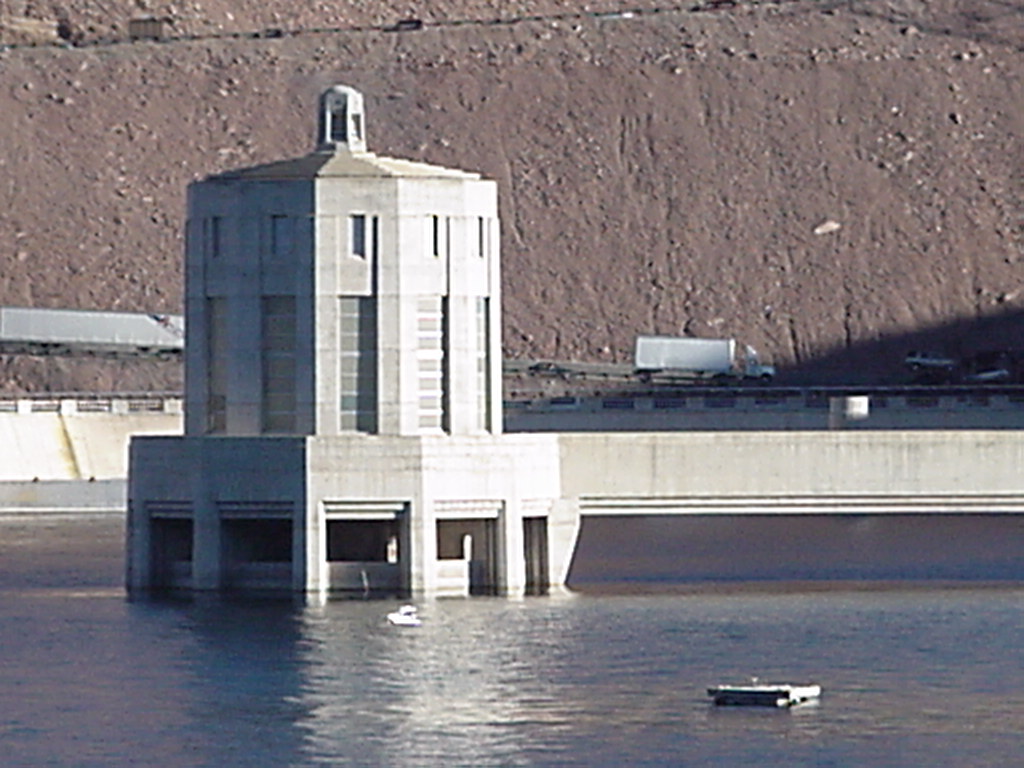
January 2009: Elevation
1111.78 feet
The red line shows the level when full. Photo © K. Dewey, UNL, SNR LINK to more Lake Mead January 2009 photos |
| The phenomenal Growth of Las Vegas has continued to
put pressure on the water resources, however, it is interesting to note that the population fell in Las Vegas and Clark County in 2008 (see below). 1905 -- Town of Las Vegas established by auctioning of land. 1911 -- The city of Las Vegas is incorporated. 1931 -- Hoover Dam construction begins in Black Canyon. 1940 -- Clark County population 16,414 (Las Vegas: 8,422). 1950 -- Clark County population 48,289 (Las Vegas: 24,624). 1960 -- Clark County population 127,016 (Las Vegas: 64,405). 1970 -- Clark County population 273,288 (Las Vegas: 125,787). 1980 -- Clark County population 463,087 (Las Vegas: 164,674) 1990 -- Clark County population 741,459 (Las Vegas: 258,295) 1995 -- Clark County population for the first time is estimated at more than 1 million residents. 2000 -- Clark County population 1,425,723 (Las Vegas: 483,448) 2001 -- Clark County's population 1,498,274 (Las Vegas: 506,111) 2003 -- Clark County's population 1,641,529 (Las Vegas: 535,395) 2006 -- Clark County population 1,912,654 (Las Vegas: 591,536) 2007 -- Clark County population 1,996,542 (Las Vegas: 602,696) 2008 -- Clark County population 1,986,146 (down 10,396 from 2007) 2008 -- Las Vegas: 599,087 (down 4,006 from 2007) 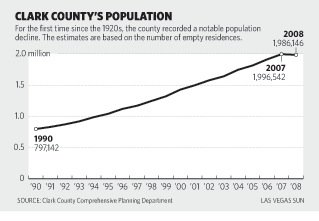 New residents arriving in Clark County: 1990: 5,128 per month 1995: 5,384 per month 2000: 6,849 per month 2006: 8,080 per month Number of visitors to Las Vegas in 1970: 6.8 million Number of visitors to Las Vegas in 2004: 37.4 million |
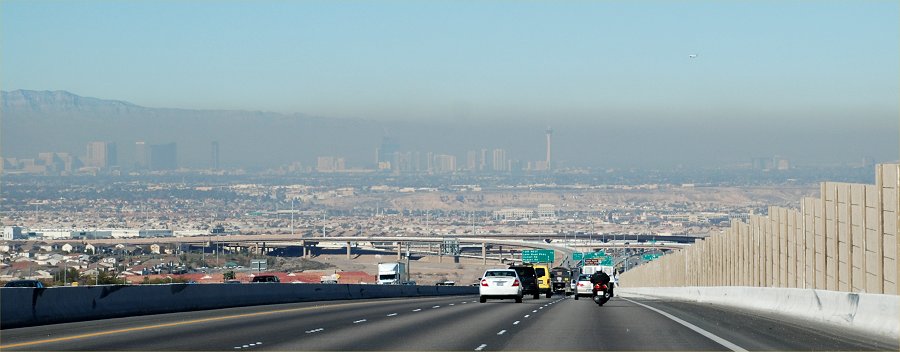
January 2009: Pollution
hangs over the Las Vegas skyline. Photo
© K. Dewey.
NOTE: LINK to more Las Vegas, January 2009 Photos
|
(with photos) The year 2007 Drought in the Southwestern U.S. The year 2006 Drought in the Southwestern U.S. The year 2003 Drought in the Southwestern U.S. The Year 2002 Drought in the Southwestern U.S. |
|
January 2009 Drought Monitor Map
Last
Year
Click HERE or on the above map to see the current U.S. Drought Monitor Map
The National Drought Mitigation Center
|
University of Nebraska-Lincoln Applied Climate Sciences, School of Natural Resources |
Return to: The Photo Gallery Index Page